Not quite. Whilst dynamic digital display has certain advantages over printed ephemera, the attention to the quality of the user experience in printed ephemera is much higher.
Public transport has come to be ‘essential’ in cities worldwide; but to use this essential service, users must first consult a timetable. Timetabling has a ‘prominent influence on the customers’ satisfaction’ with the service provided, and it therefore follows that the way in which passengers read this information is exceptionally important.
This dissertation presents a close comparative analysis of bus timetable information design in the period between 1980 and 2025, with a primary concern for the shift of document format – from printed matter to dynamic digital display.
How I did it
I made two visits to the Bus Ephemera box at Reading Central Library and catalogued more than 50 timetable records, alongside items from my own collection of Reading Buses material and archived pages of the company’s website.
To keep the comparison about the passenger, I built a framework from the literature on travel information design, chiefly Thelen (1979), McCann (1981) and Bartram (1980, 1984). It sorts what a timetable does into four parts – key route information, the network overview, the times themselves, and changes and delays to the service – and ten criteria within them.
I then applied the framework to four eras – the 1980s, the 1990s, the early 2000s, and the late 2000s to the 2020s – comparing the printed leaflets, the website and the mobile app in each.
The question
Public transport has come to be ‘essential’ in cities worldwide; but to use this essential service, users must first consult a timetable. Timetabling has a ‘prominent influence on the customers’ satisfaction’ with the service provided, and it therefore follows that the way in which passengers read this information is exceptionally important.
This dissertation presents a close comparative analysis of bus timetable information design in the period between 1980 and 2025, with a primary concern for the shift of document format – from printed matter to dynamic digital display.
How I did it
I made two visits to the Bus Ephemera box at Reading Central Library and catalogued more than 50 timetable records, alongside items from my own collection of Reading Buses material and archived pages of the company’s website.
To keep the comparison about the passenger, I built a framework from the literature on travel information design, chiefly Thelen (1979), McCann (1981) and Bartram (1980, 1984). It sorts what a timetable does into four parts – key route information, the network overview, the times themselves, and changes and delays to the service – and ten criteria within them.
I then applied the framework to four eras – the 1980s, the 1990s, the early 2000s, and the late 2000s to the 2020s – comparing the printed leaflets, the website and the mobile app in each.
Printed timetables from the 1980s to the 2020s
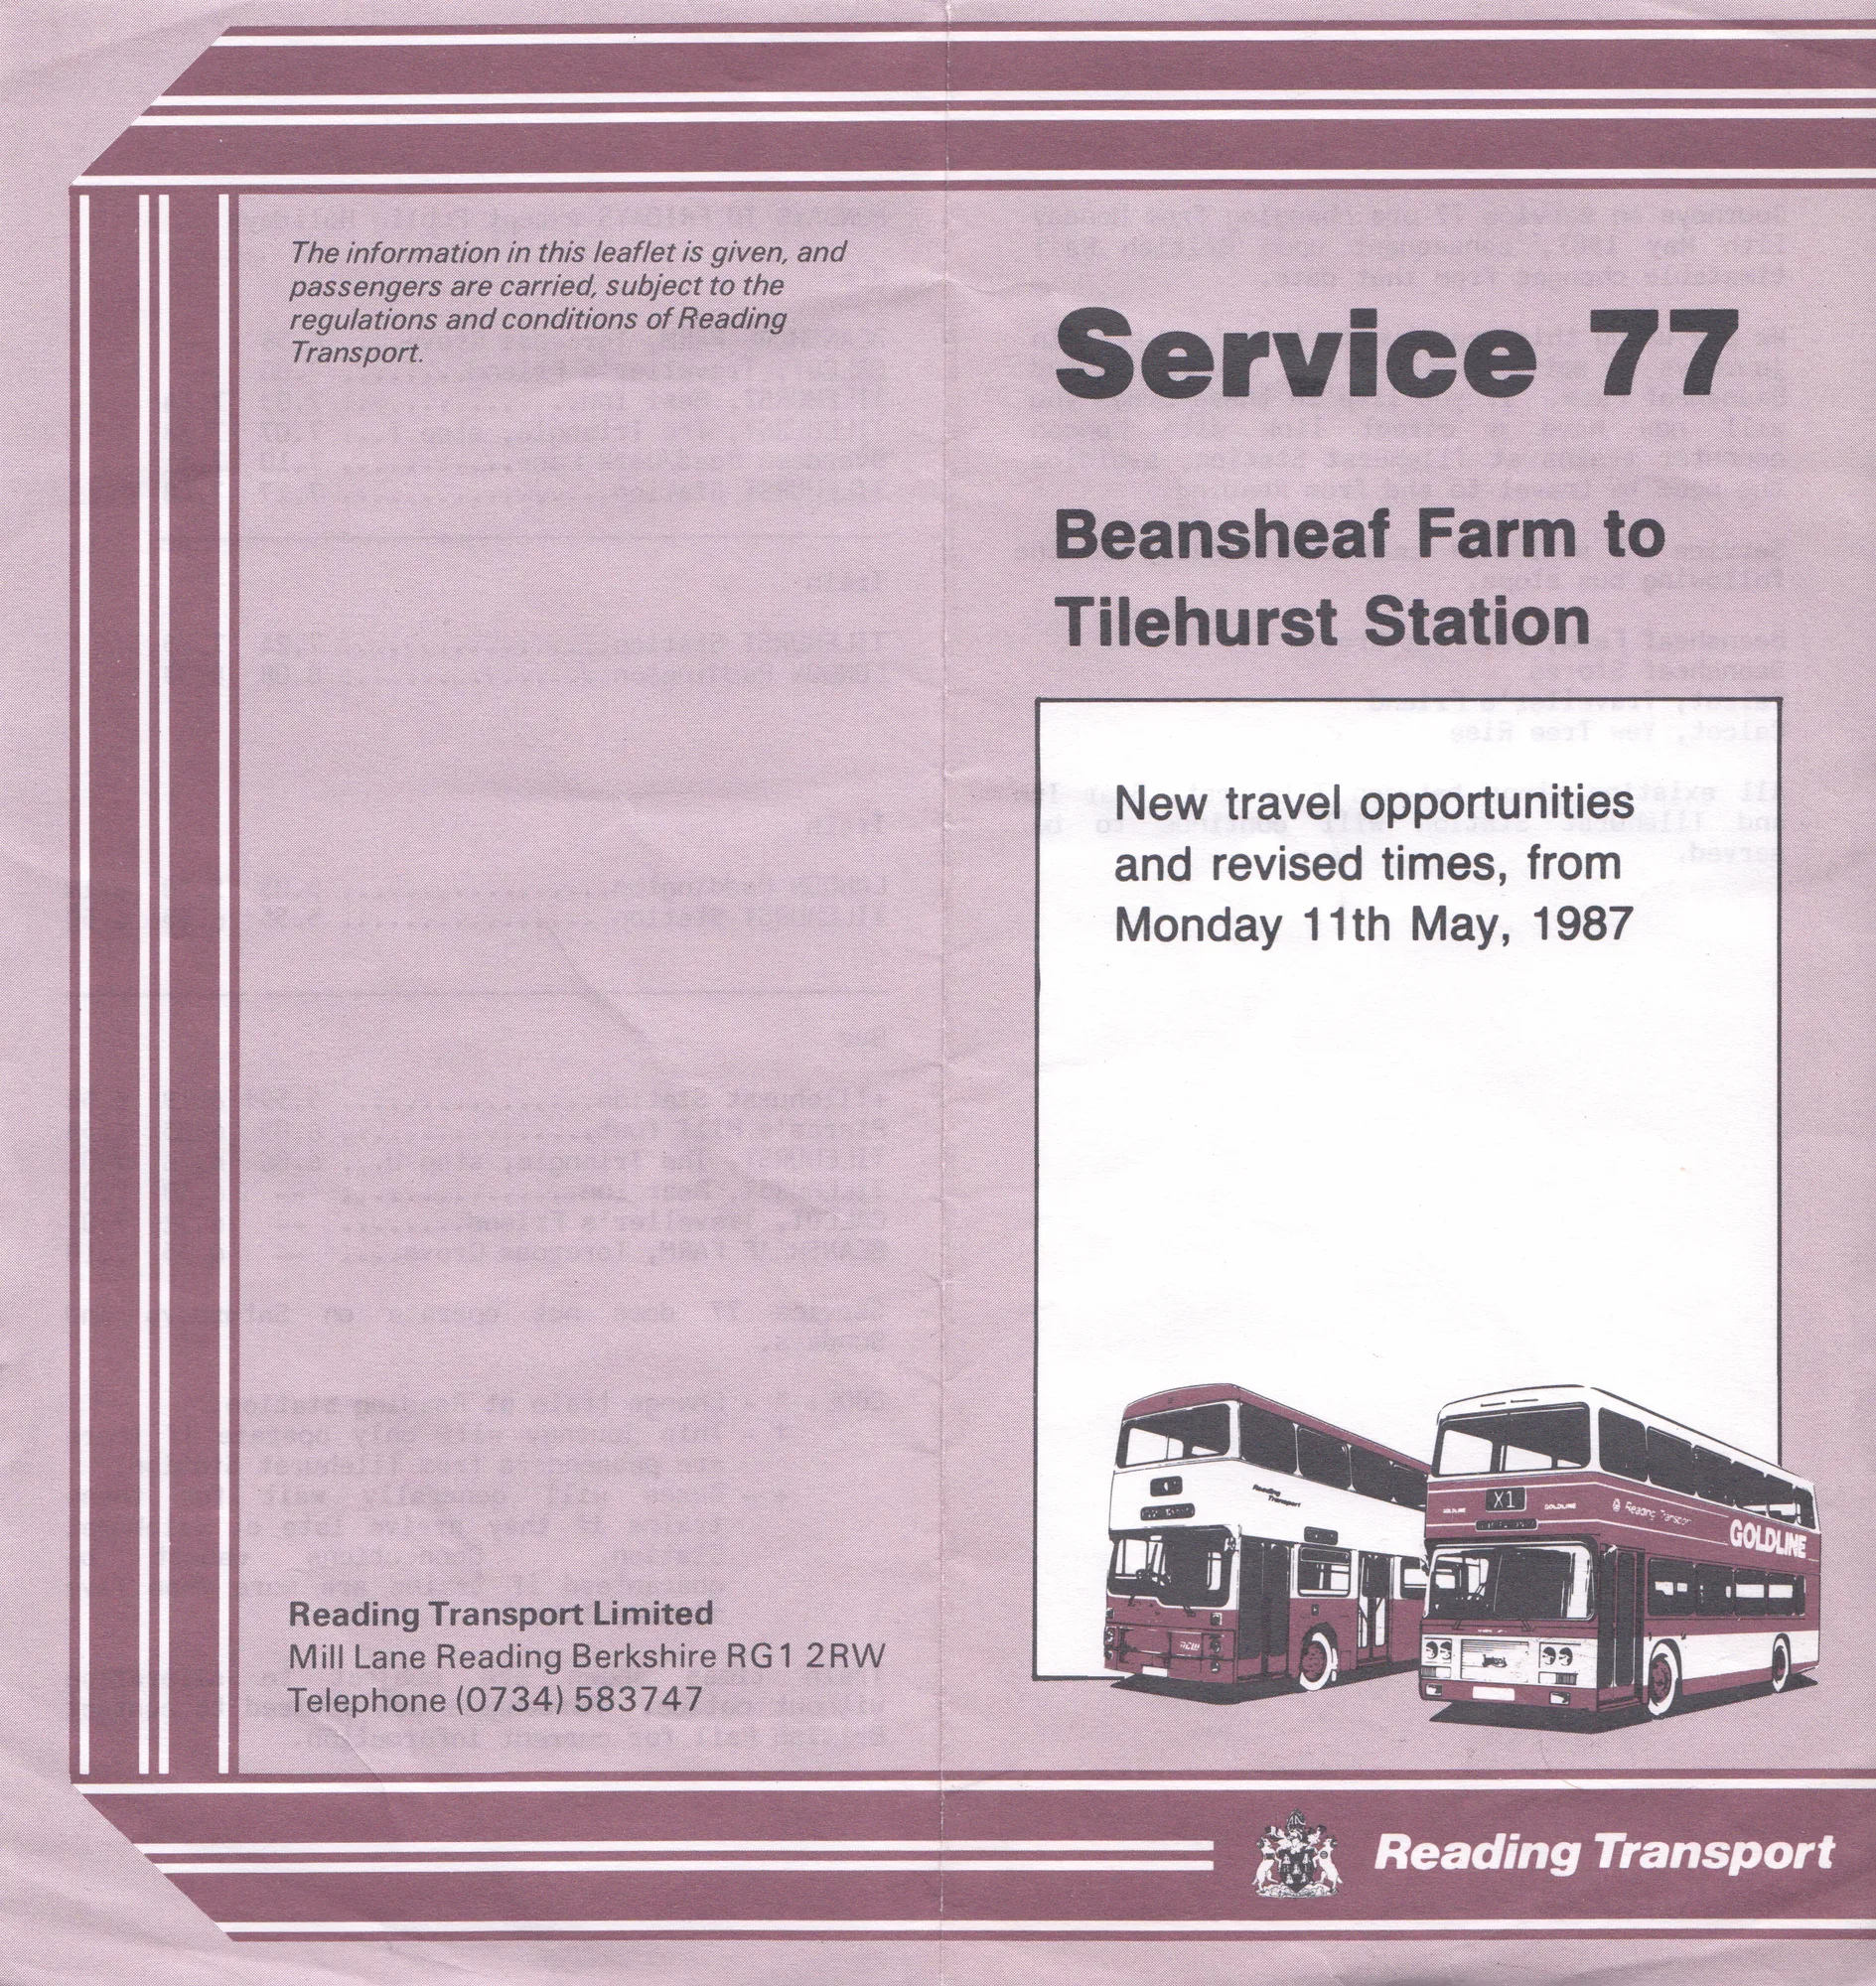
1987Printed on poor-quality paper; the typewritten nature of the type suggests little thought was employed to enhance or consider the user experience.Service guide for route 77Published by Reading Transport (11 May 1987)200 × 210 mmReading Central Library: Bus Ephemera box
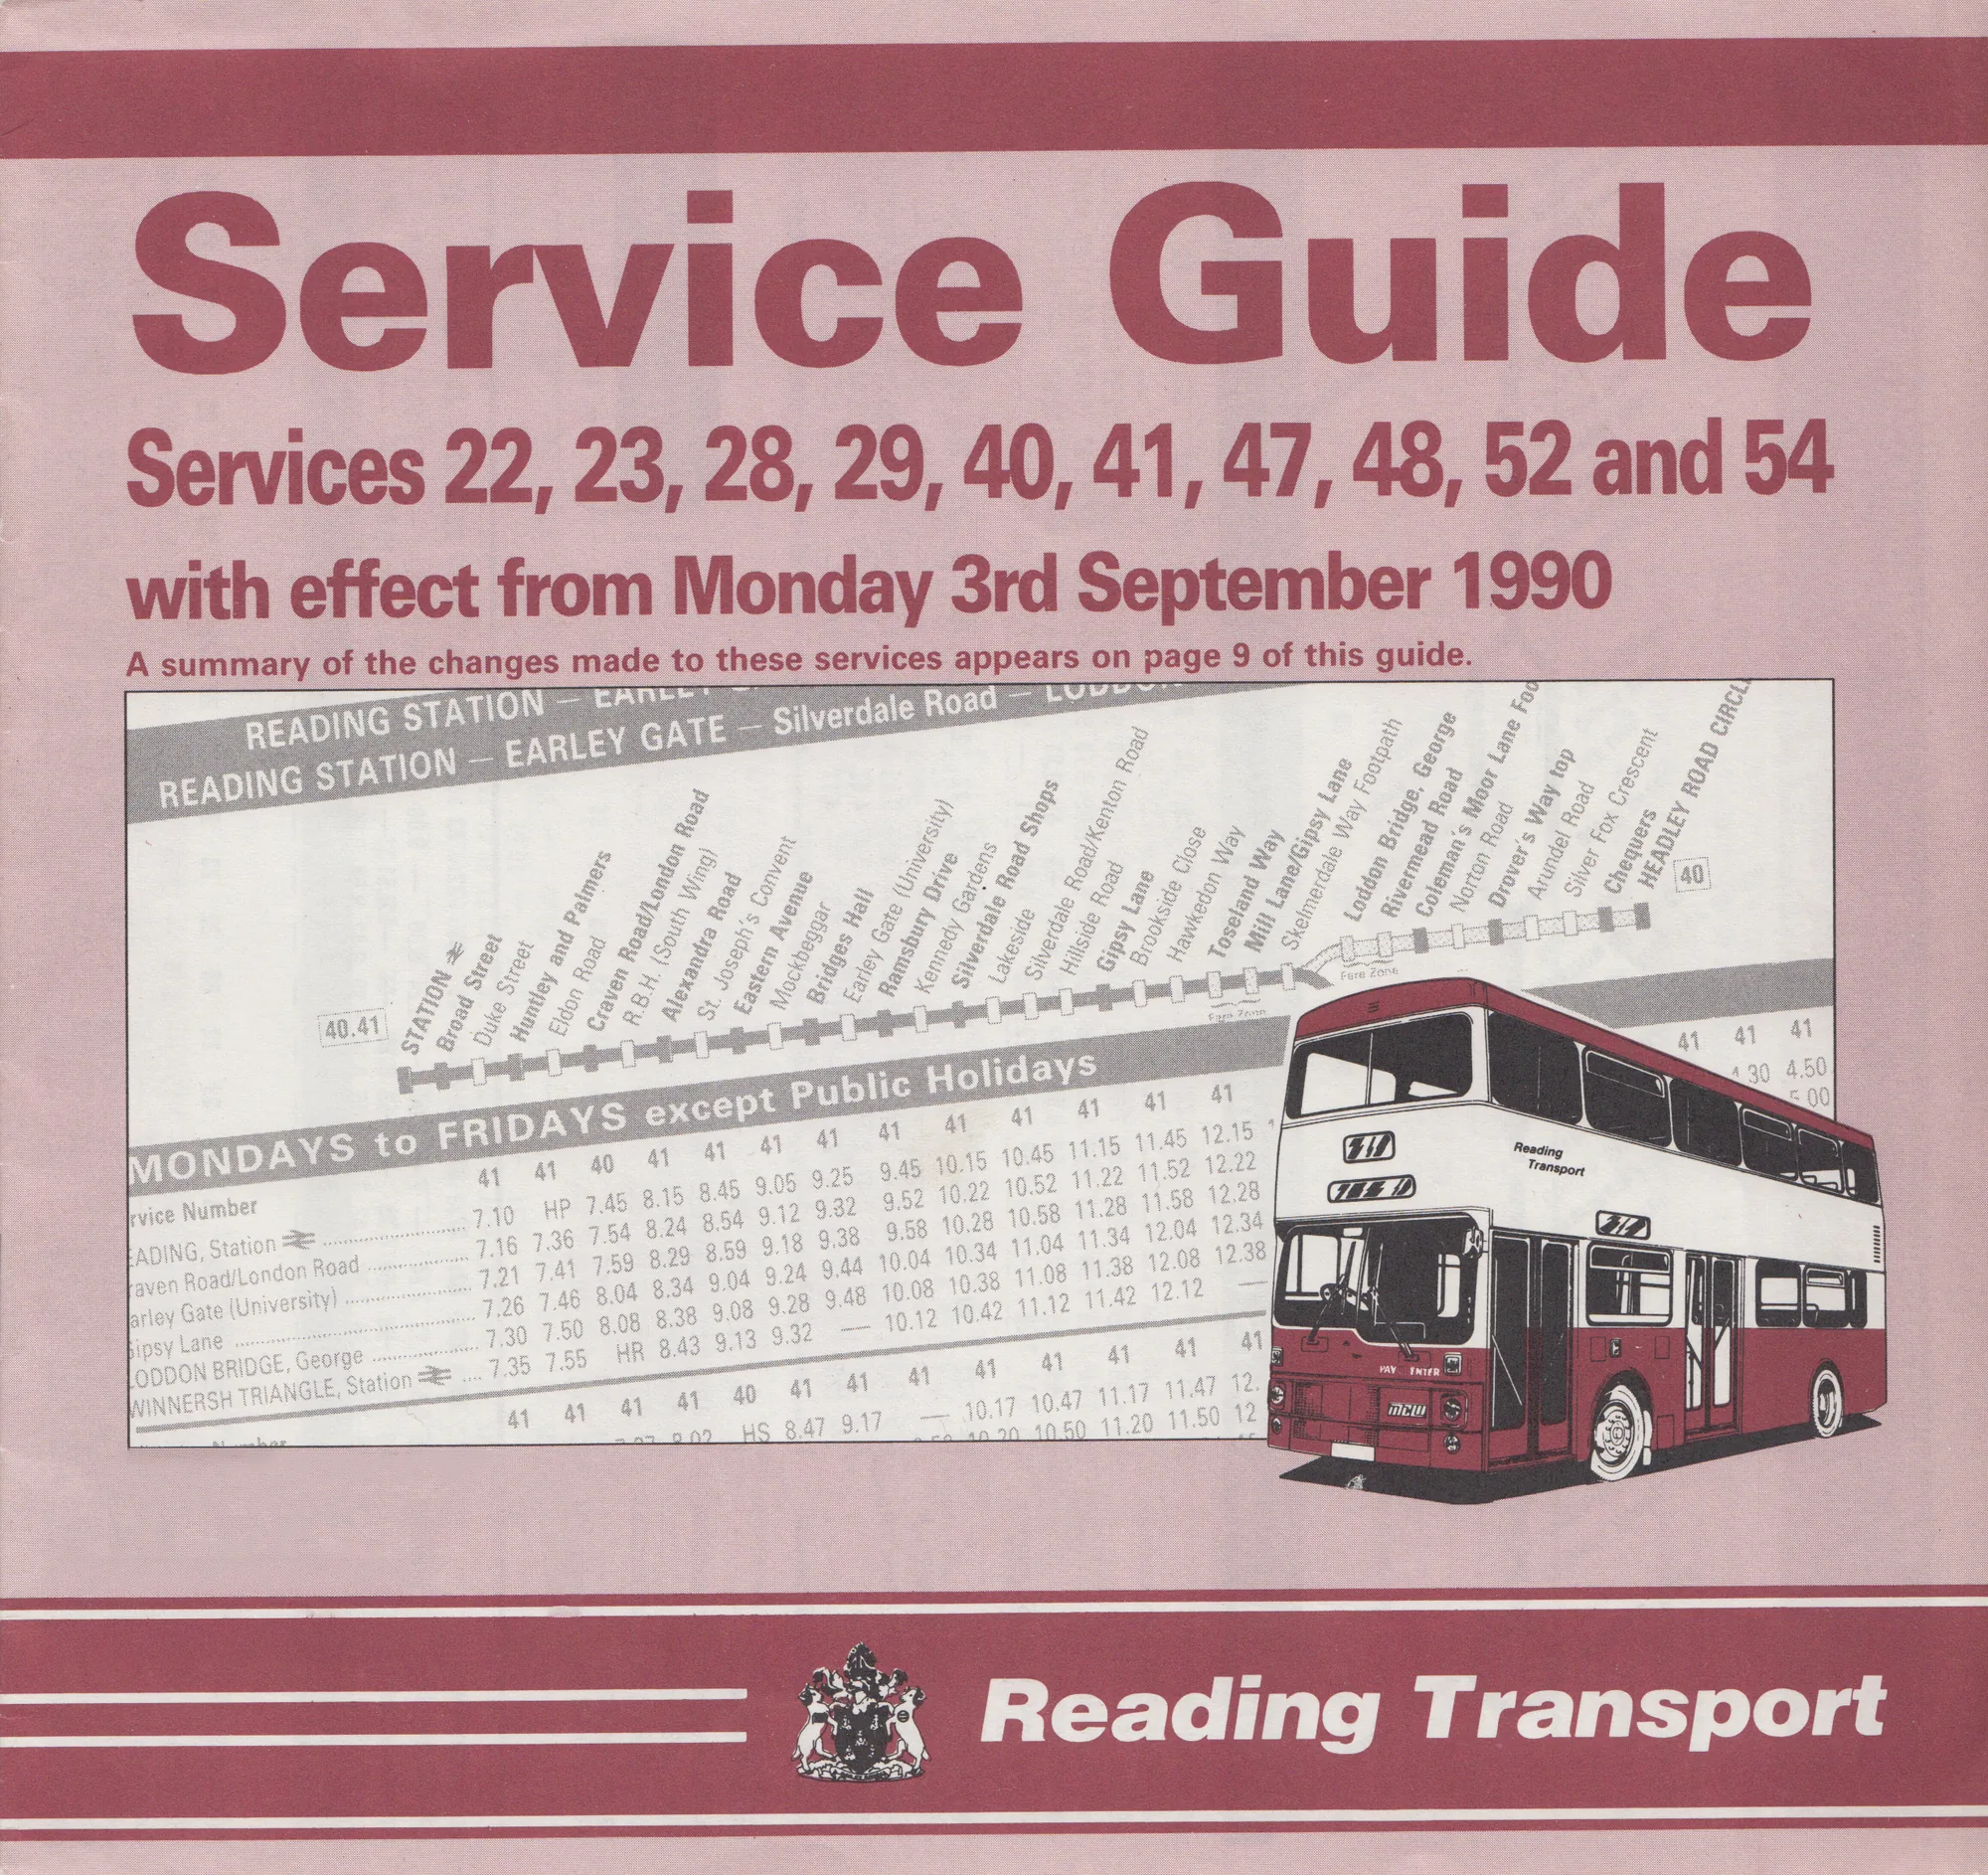
1990Issued under the Reading Transport name, a year before the company became Reading Buses.Service guide for services 22, 23, 28, 29, 40, 41, 47, 48, 52 and 54Published by Reading Transport (3 September 1990)209 × 197 mmReading Central Library: Bus Ephemera box
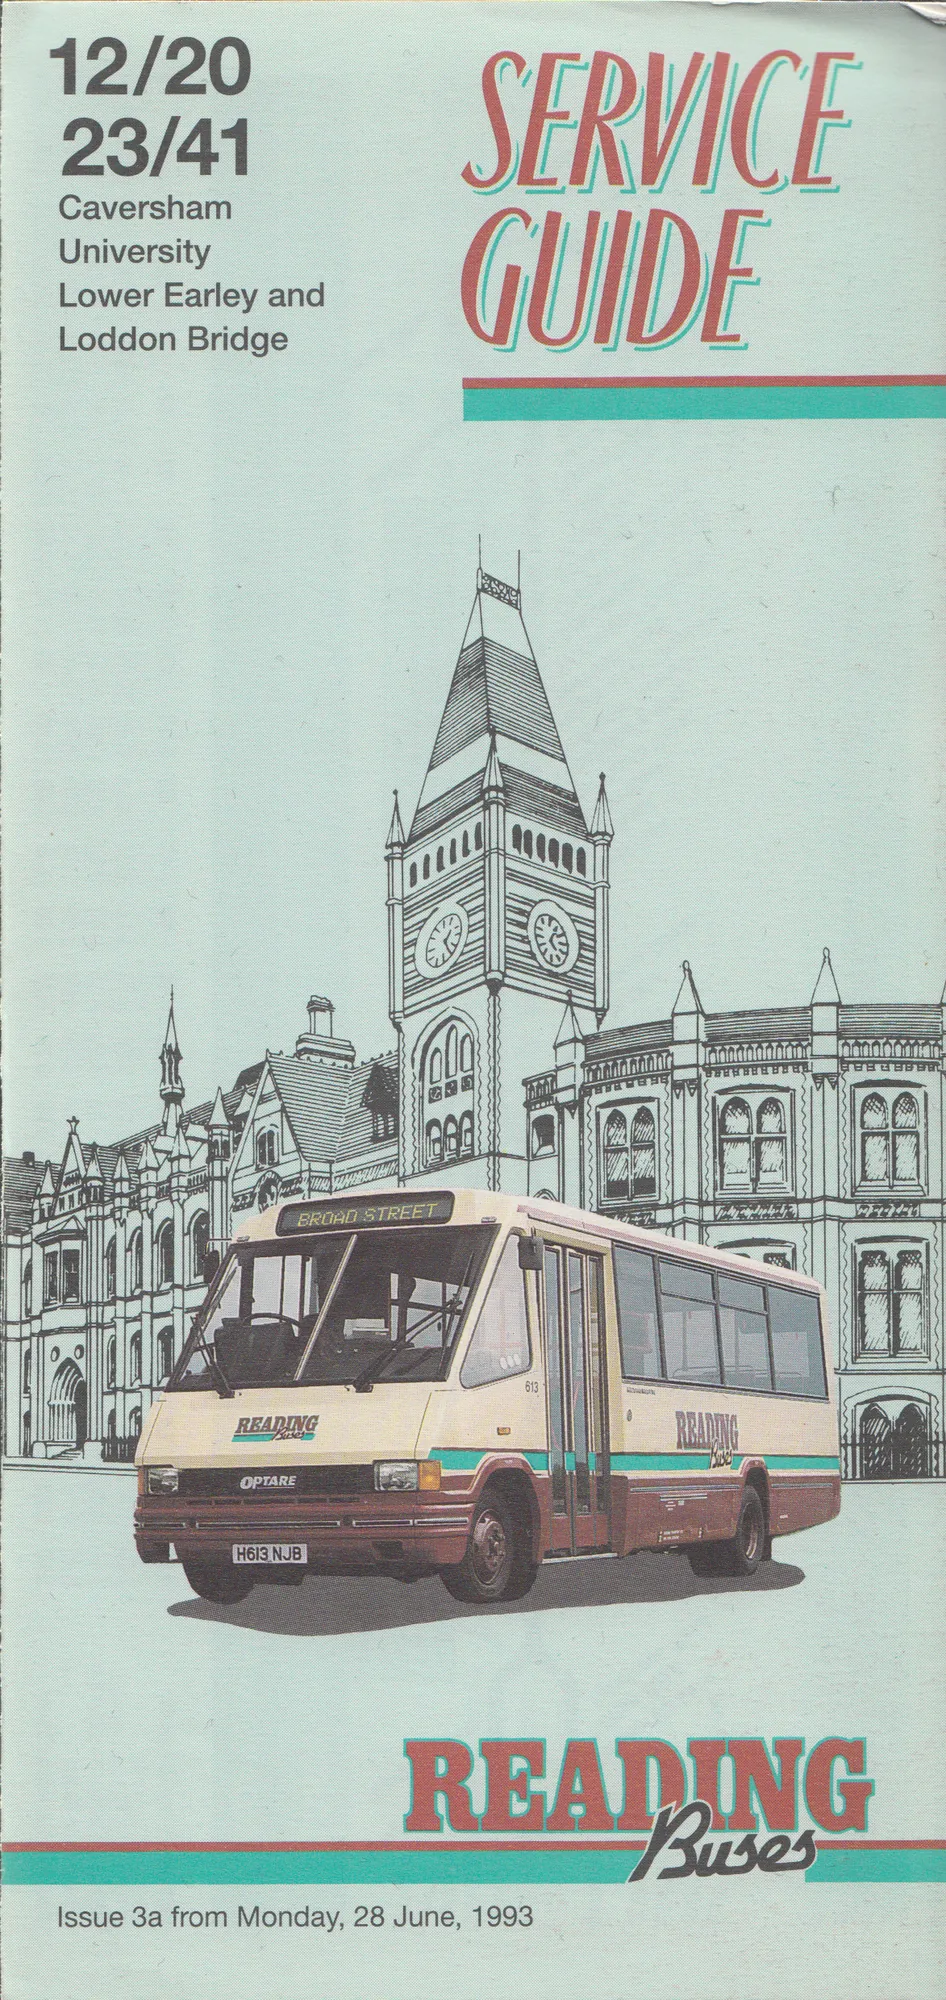
1993By 1993 the word ‘service’ had dropped off, and the route numbers were as visually important as the title.Service guide for routes 12, 20, 23 and 41Published by Reading Buses (28 June 1993)100 × 210 mmReading Central Library: Bus Ephemera box
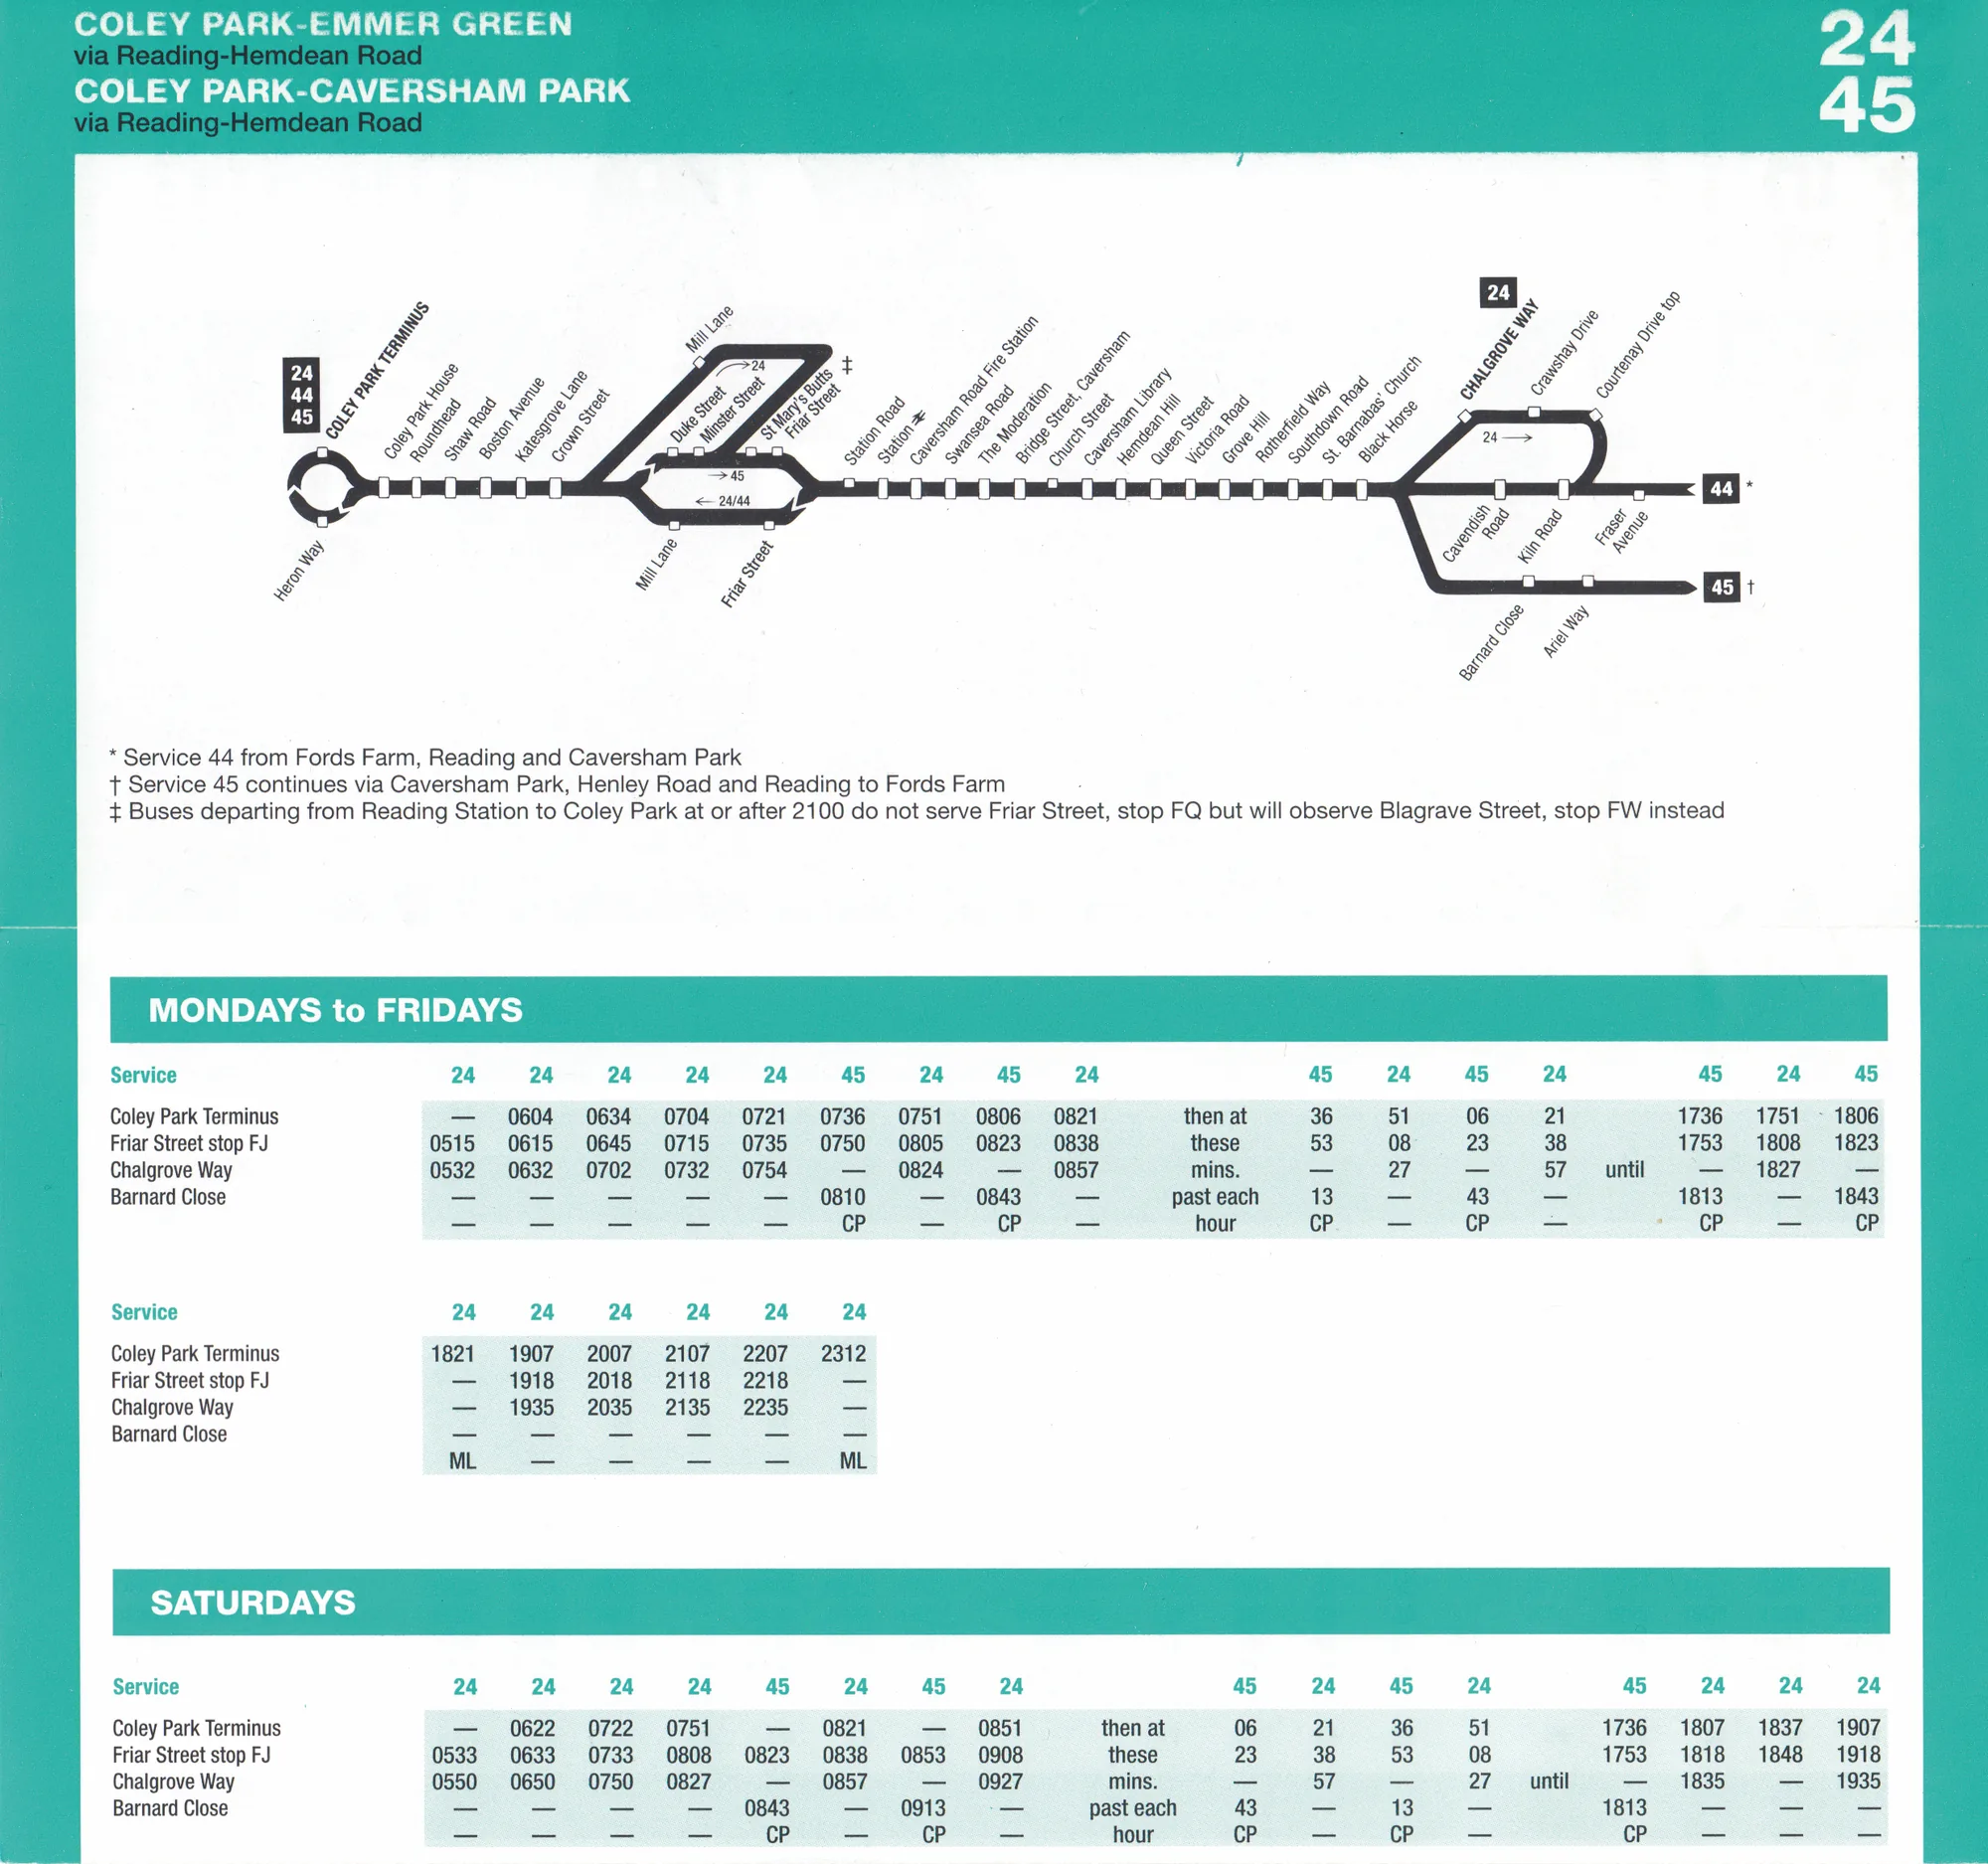
1997Colour outlines the service availability, and the route map is a new addition.Service guide for routes 24, 44 and 45Published by Reading Buses (27 October 1997)210 × 200 mmReading Central Library: Bus Ephemera box
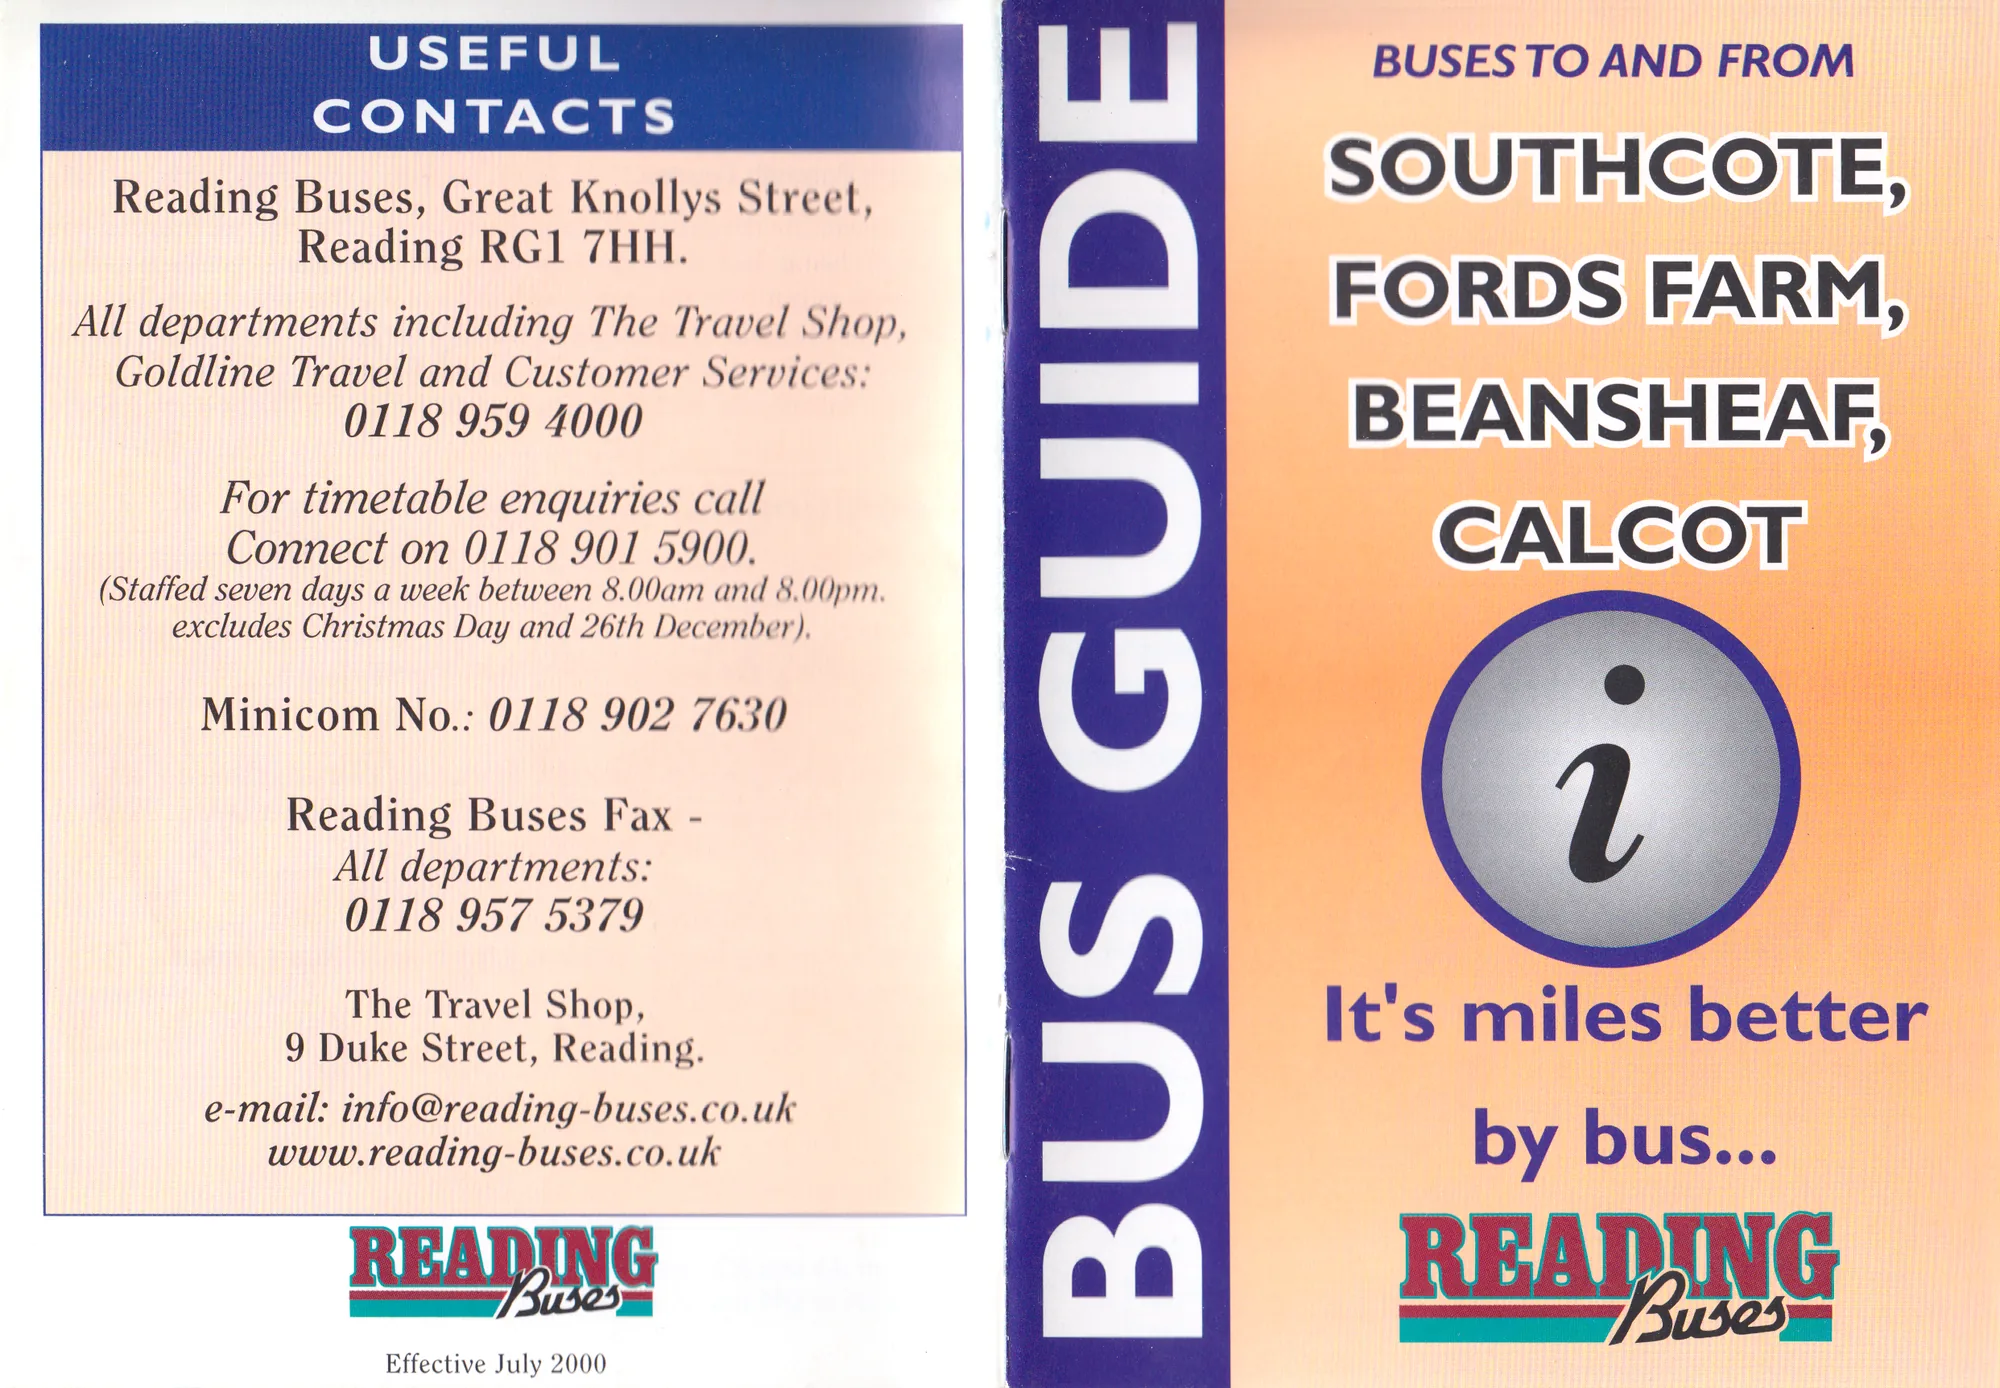
2000Booklets now cover an area of Reading, and the front carries no route numbers.Southcote, Fords Farm, Beansheaf and Calcot bus guidePublished by Reading Buses (July 2000)Covers 210 × 148 mm, opened outReading Central Library: Bus Ephemera box
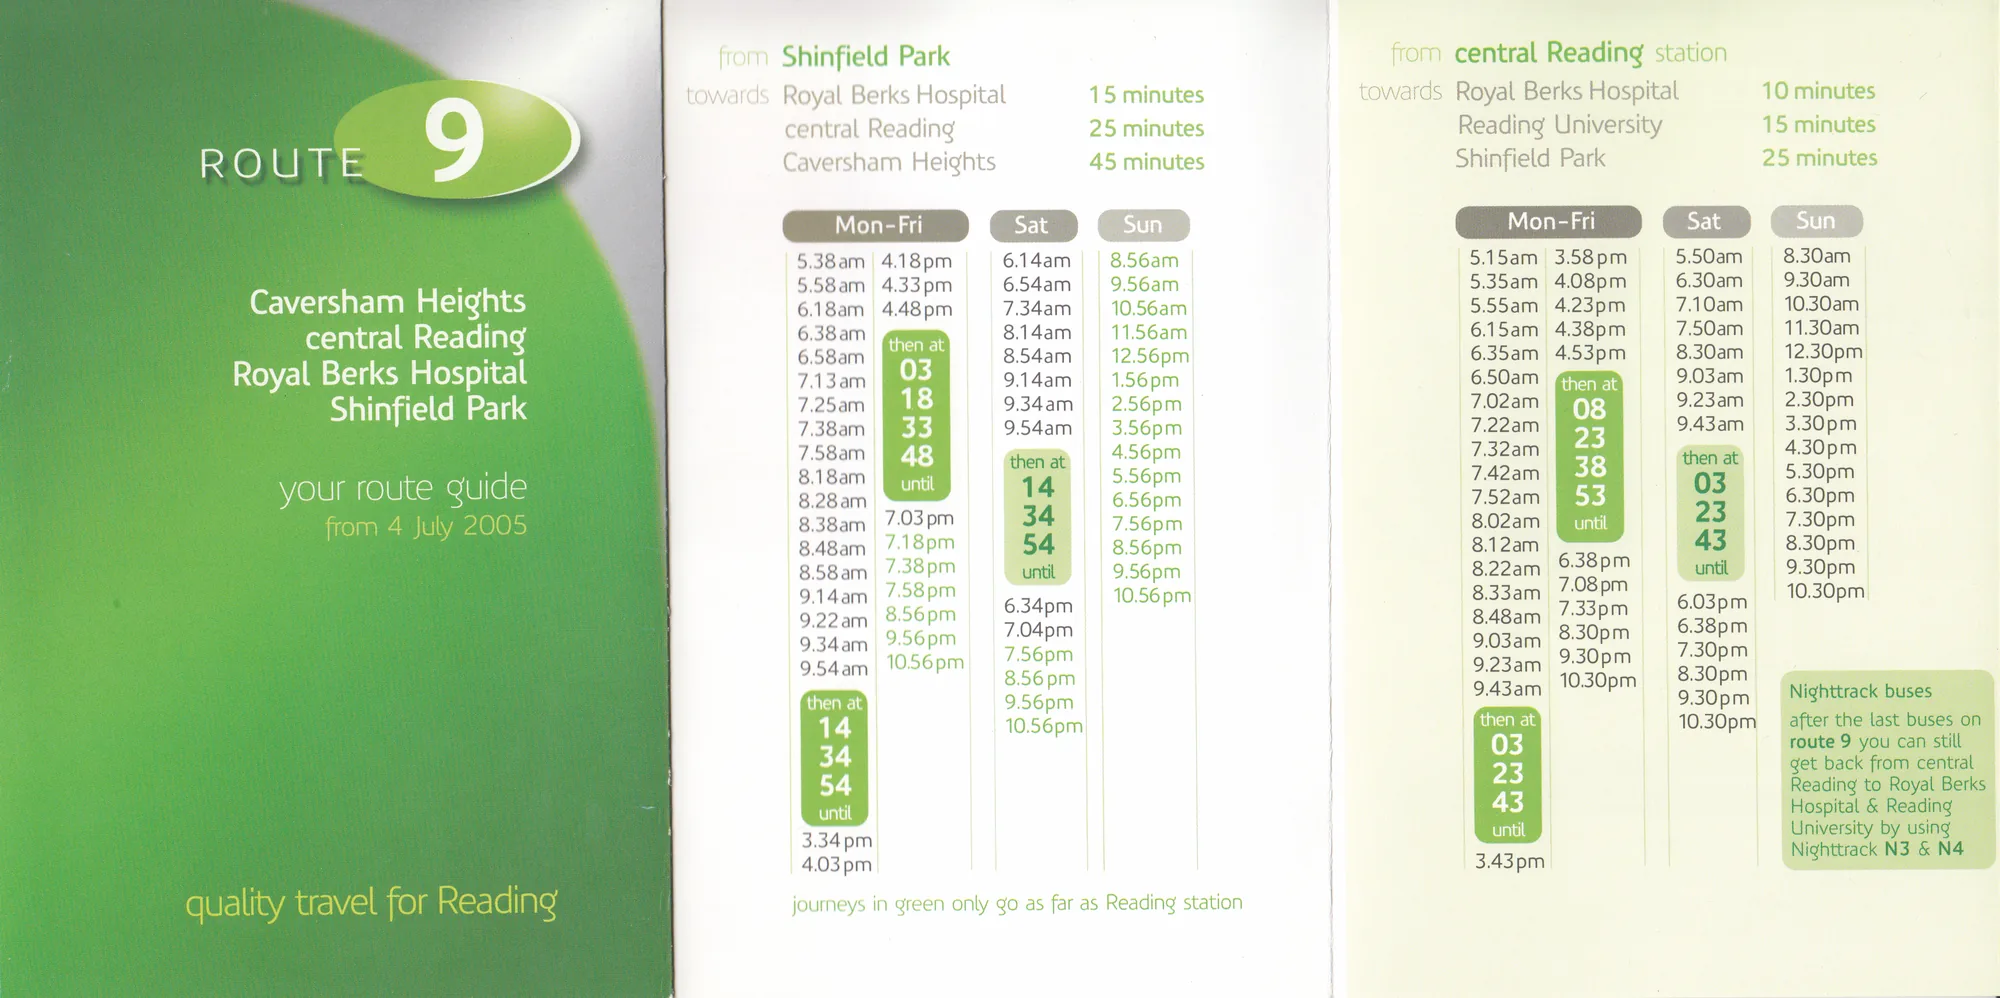
2005Each route was given a distinctive colour; route 9 is green.Your route guide: route 9Published by Reading Buses (4 July 2005); designed by Best ImpressionsCover 105 × 148 mmReading Central Library: Bus Ephemera box
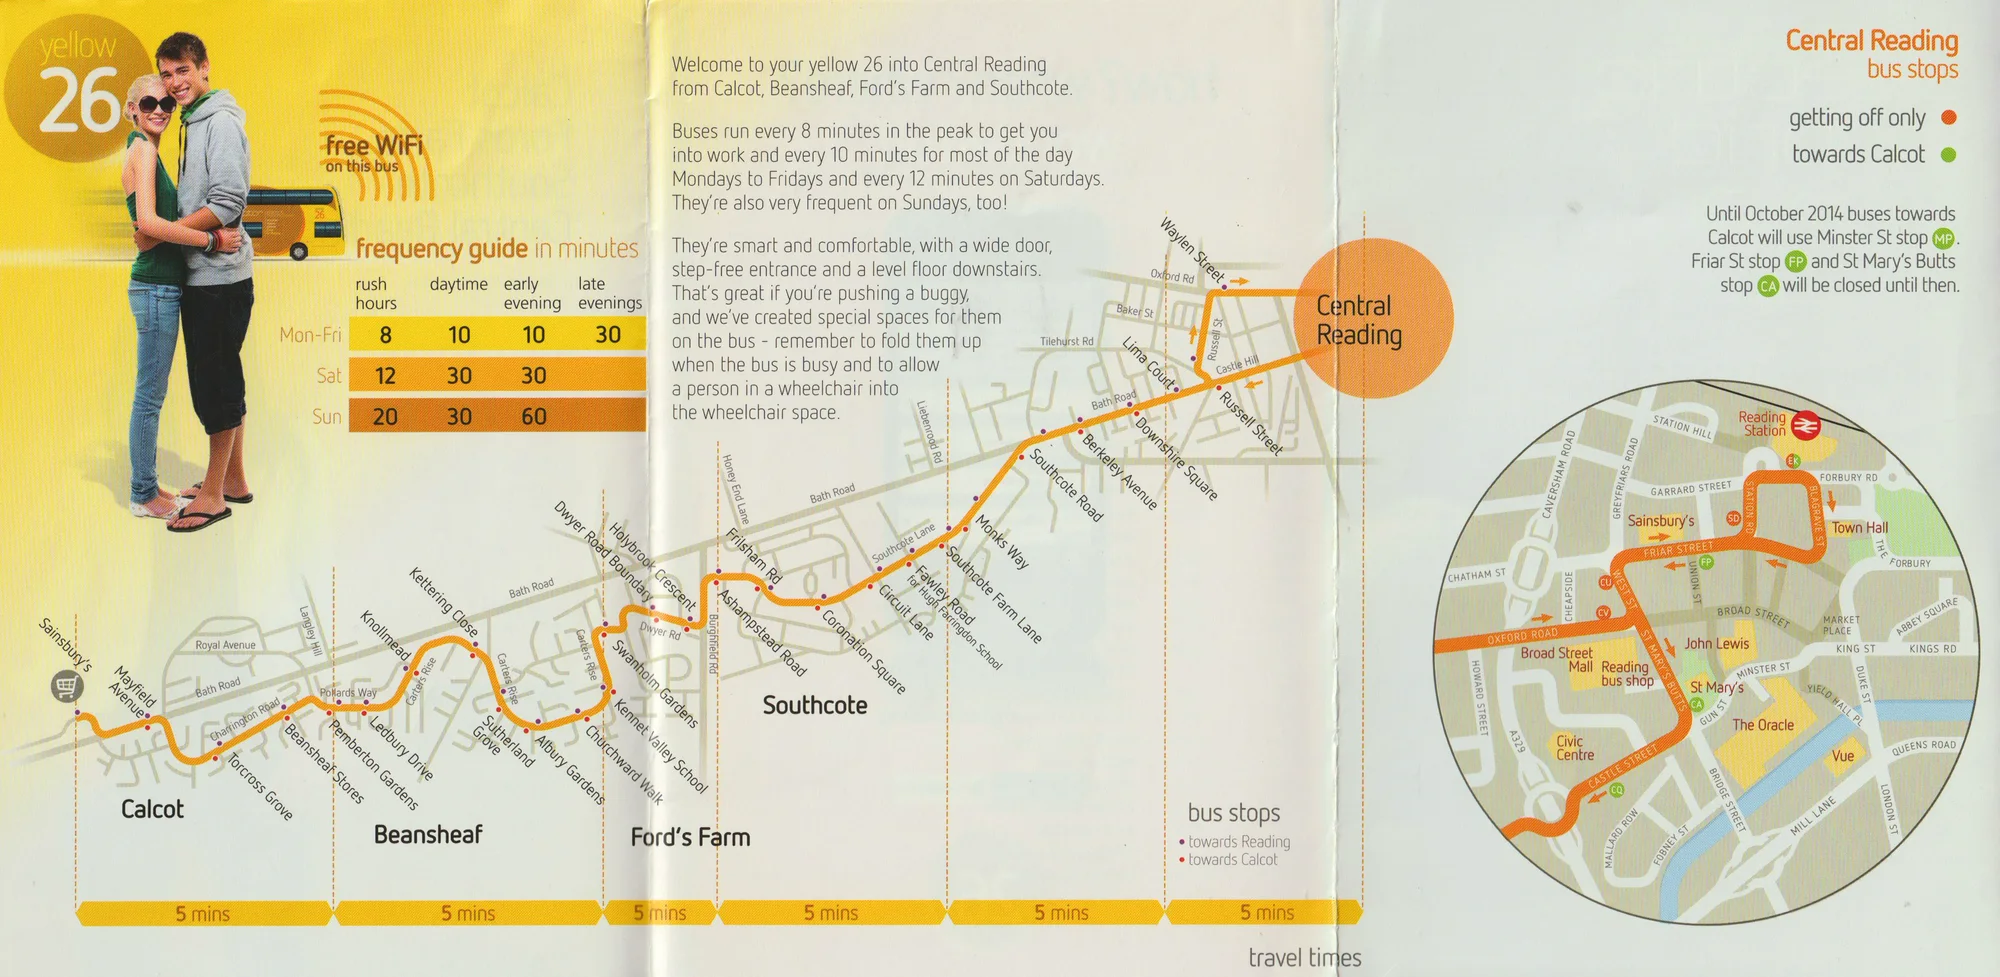
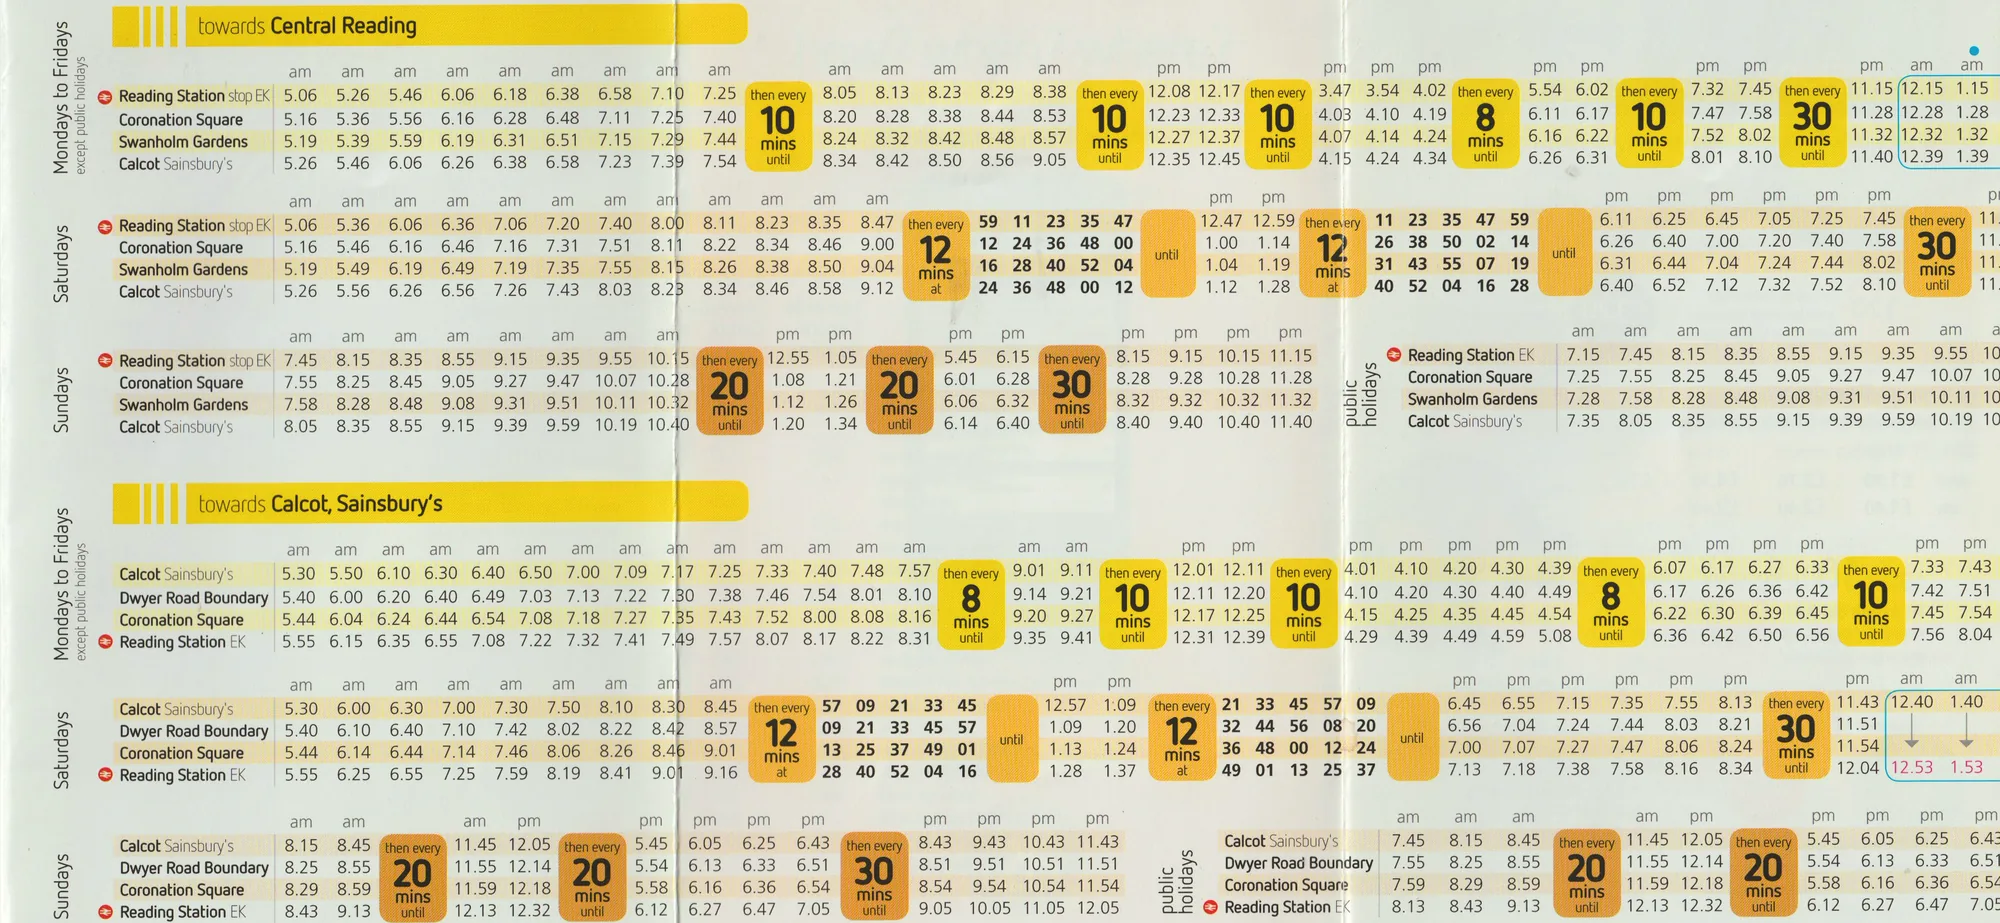
2014After 2010, printed timetables reverted to a ‘standard’ perspective and featured a much greater range of stops.Yellow 26 timetablePublished by Reading Buses (1 October 2014)Interior spread 315 × 148 mmAuthor’s collection
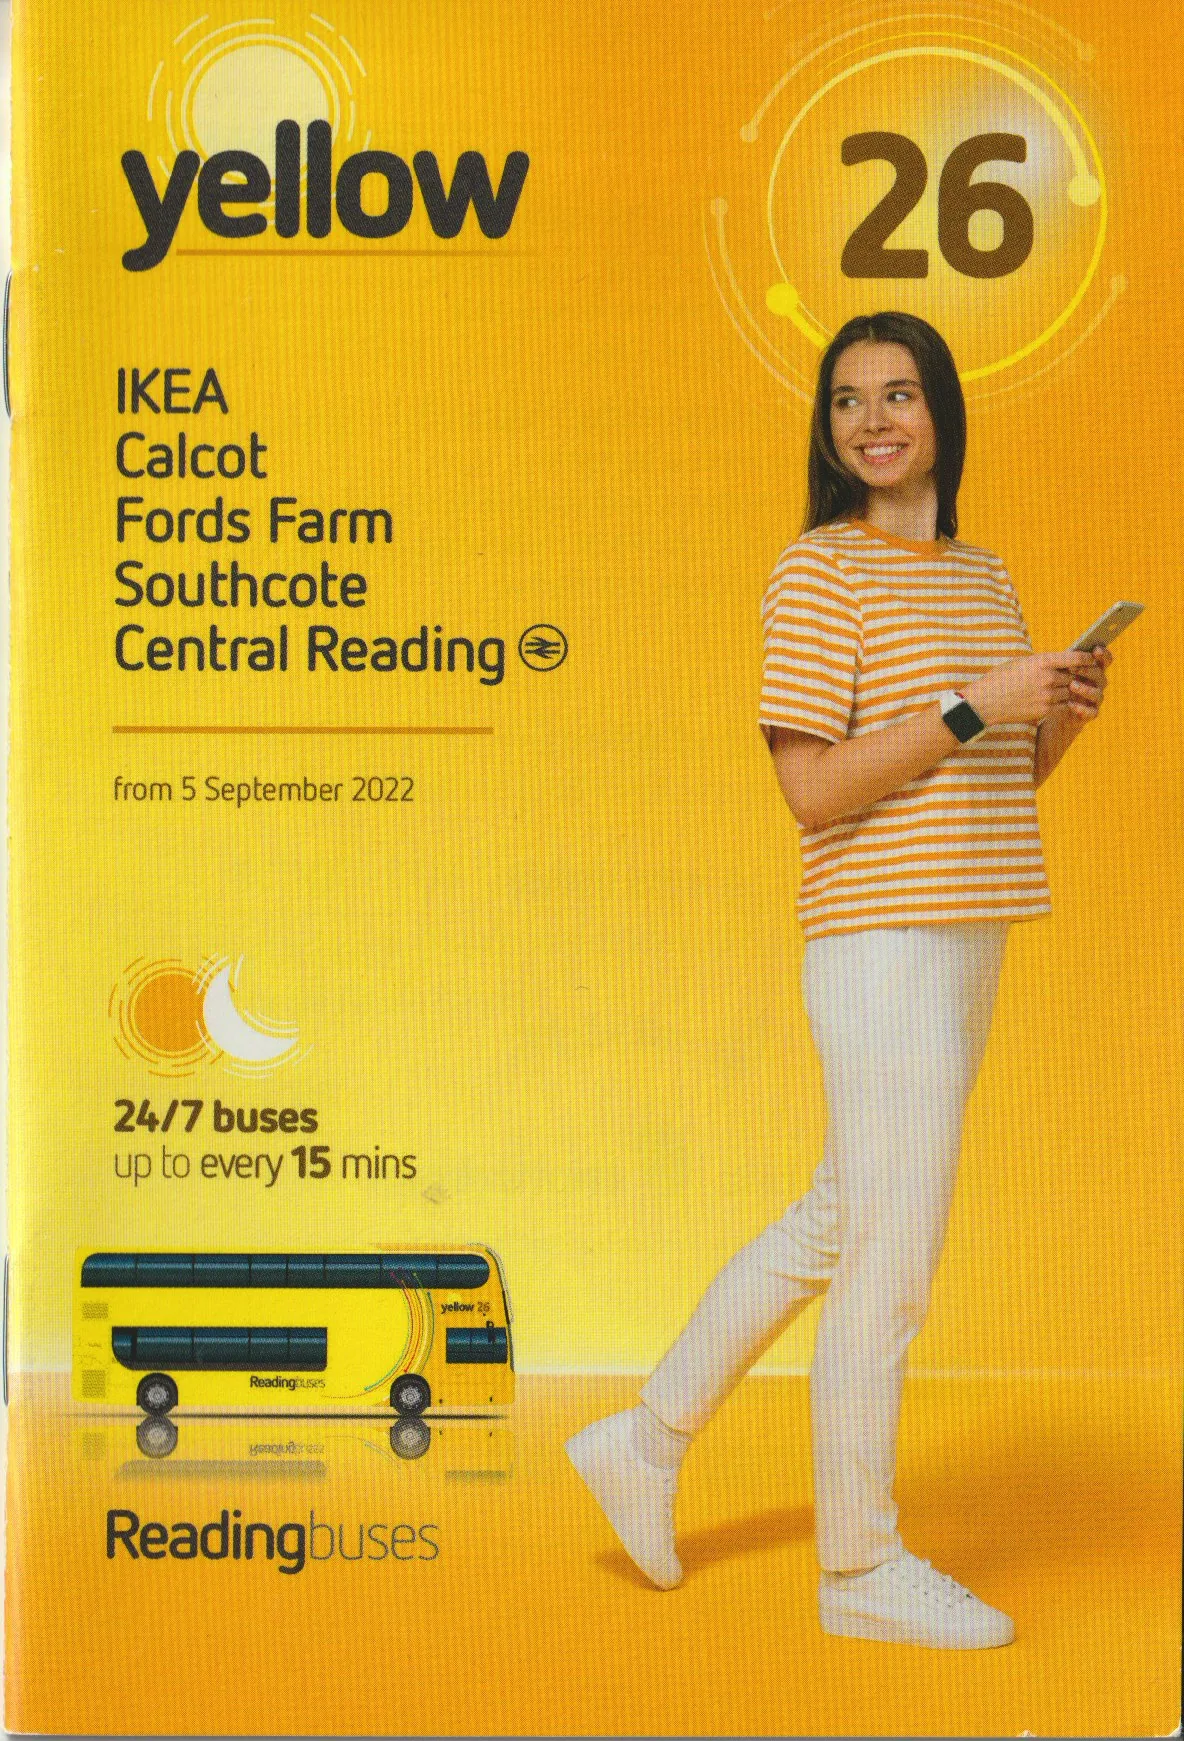
2022The route colour, a stylised bus and the destinations served, all on the front.Yellow 26 timetablePublished by Reading Buses (5 September 2022)100 × 147 mmAuthor’s collection
One route, two formats
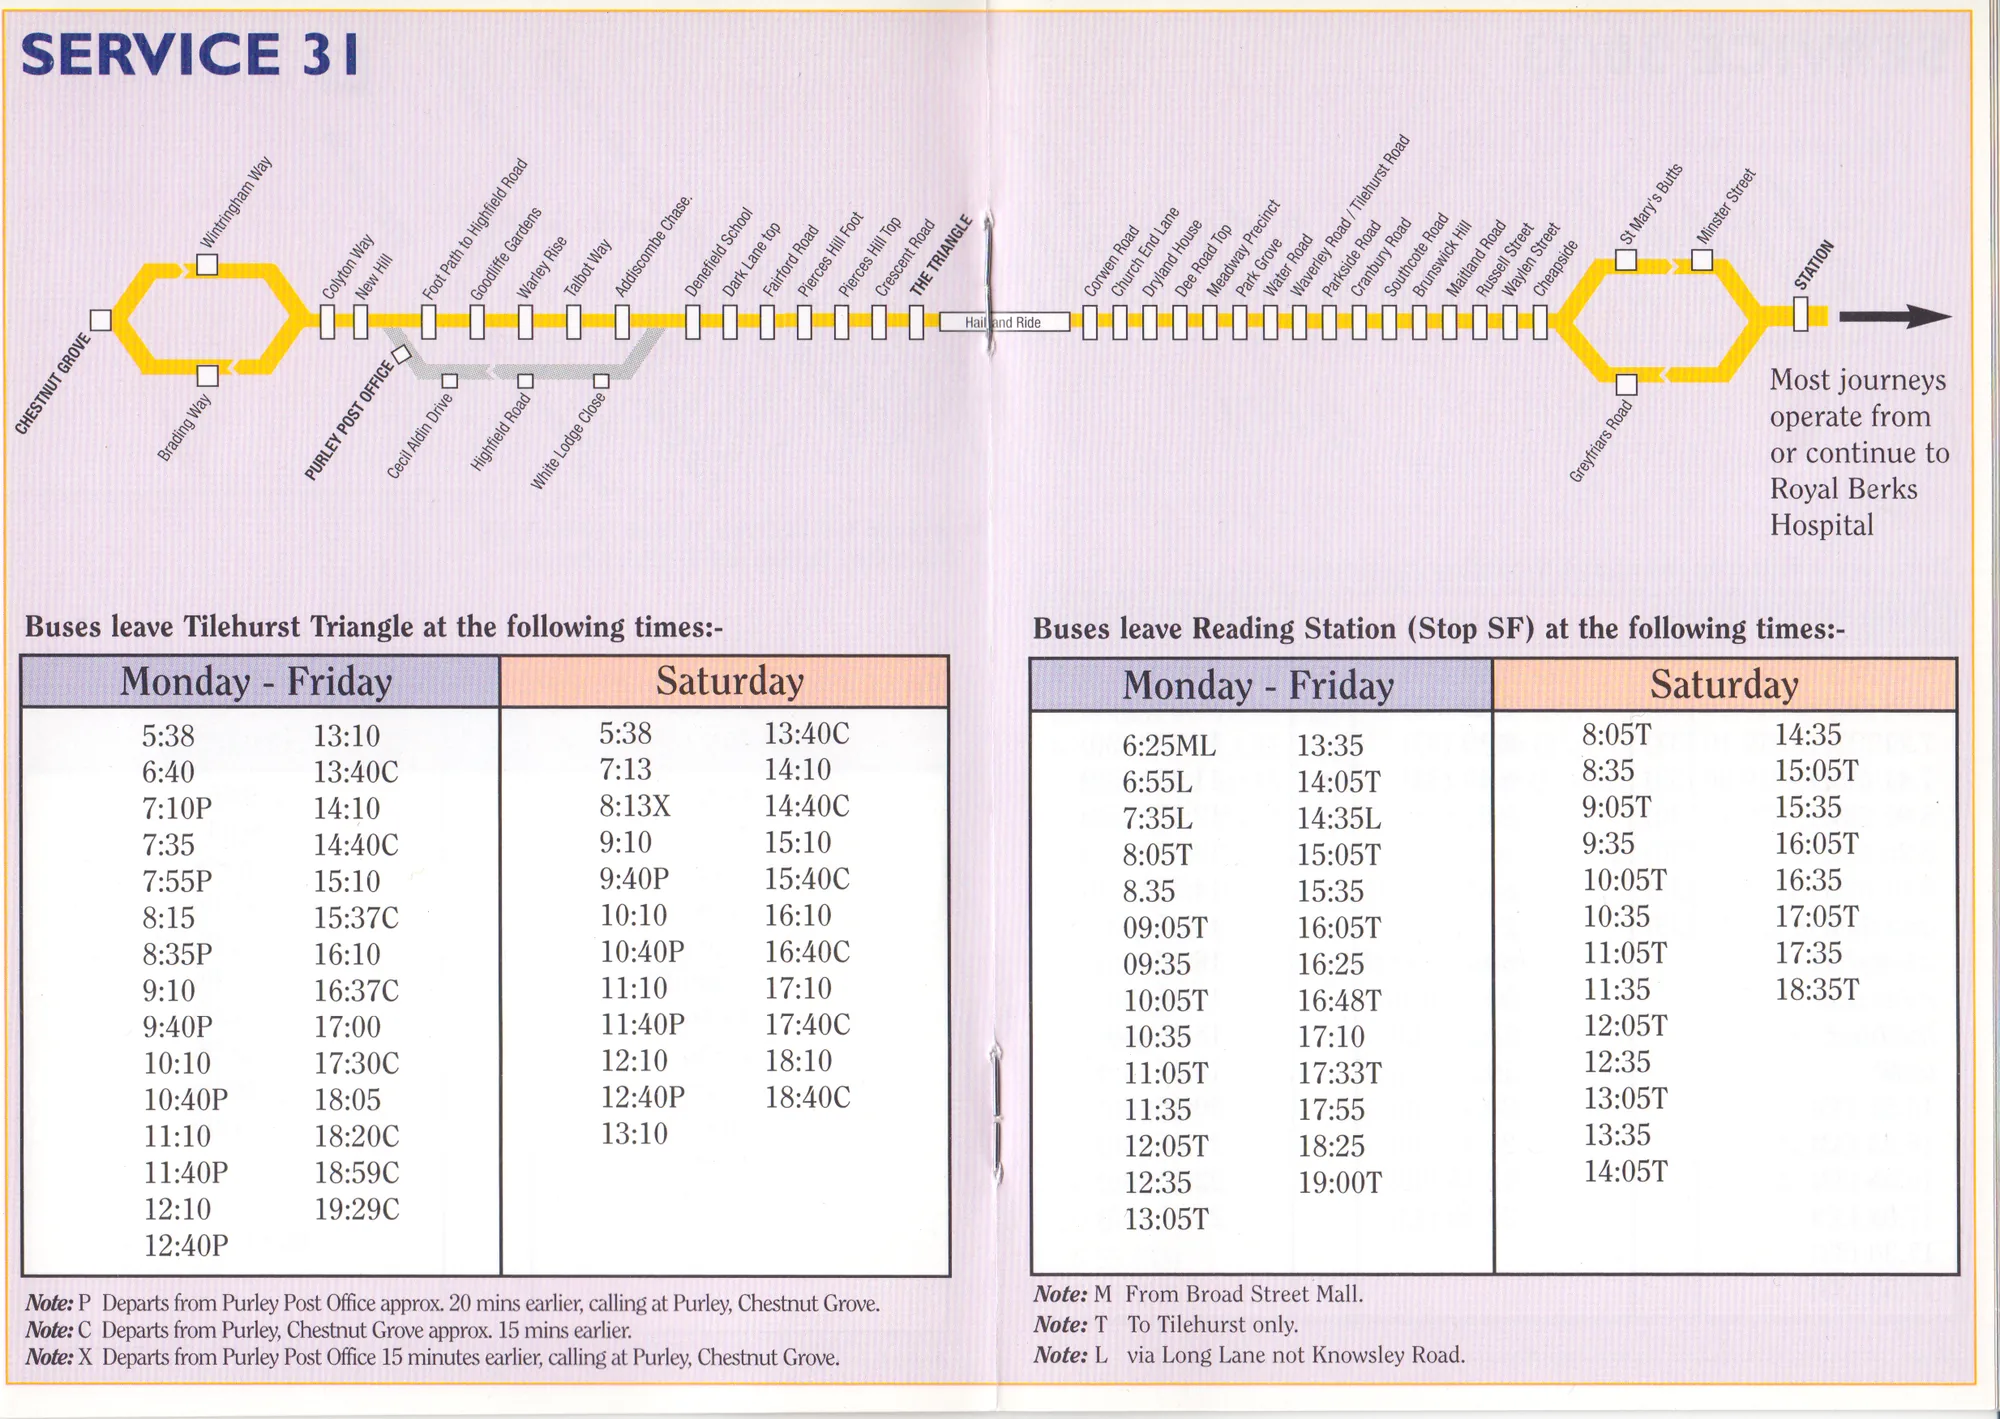
Route 31, November 2000. Even when it can be argued that the presentation on digital screens allowed for the dynamic display of routes, early digital timetables were very often nothing more than a digital edition of the printed schedule. Hover over or select a number to read the note.
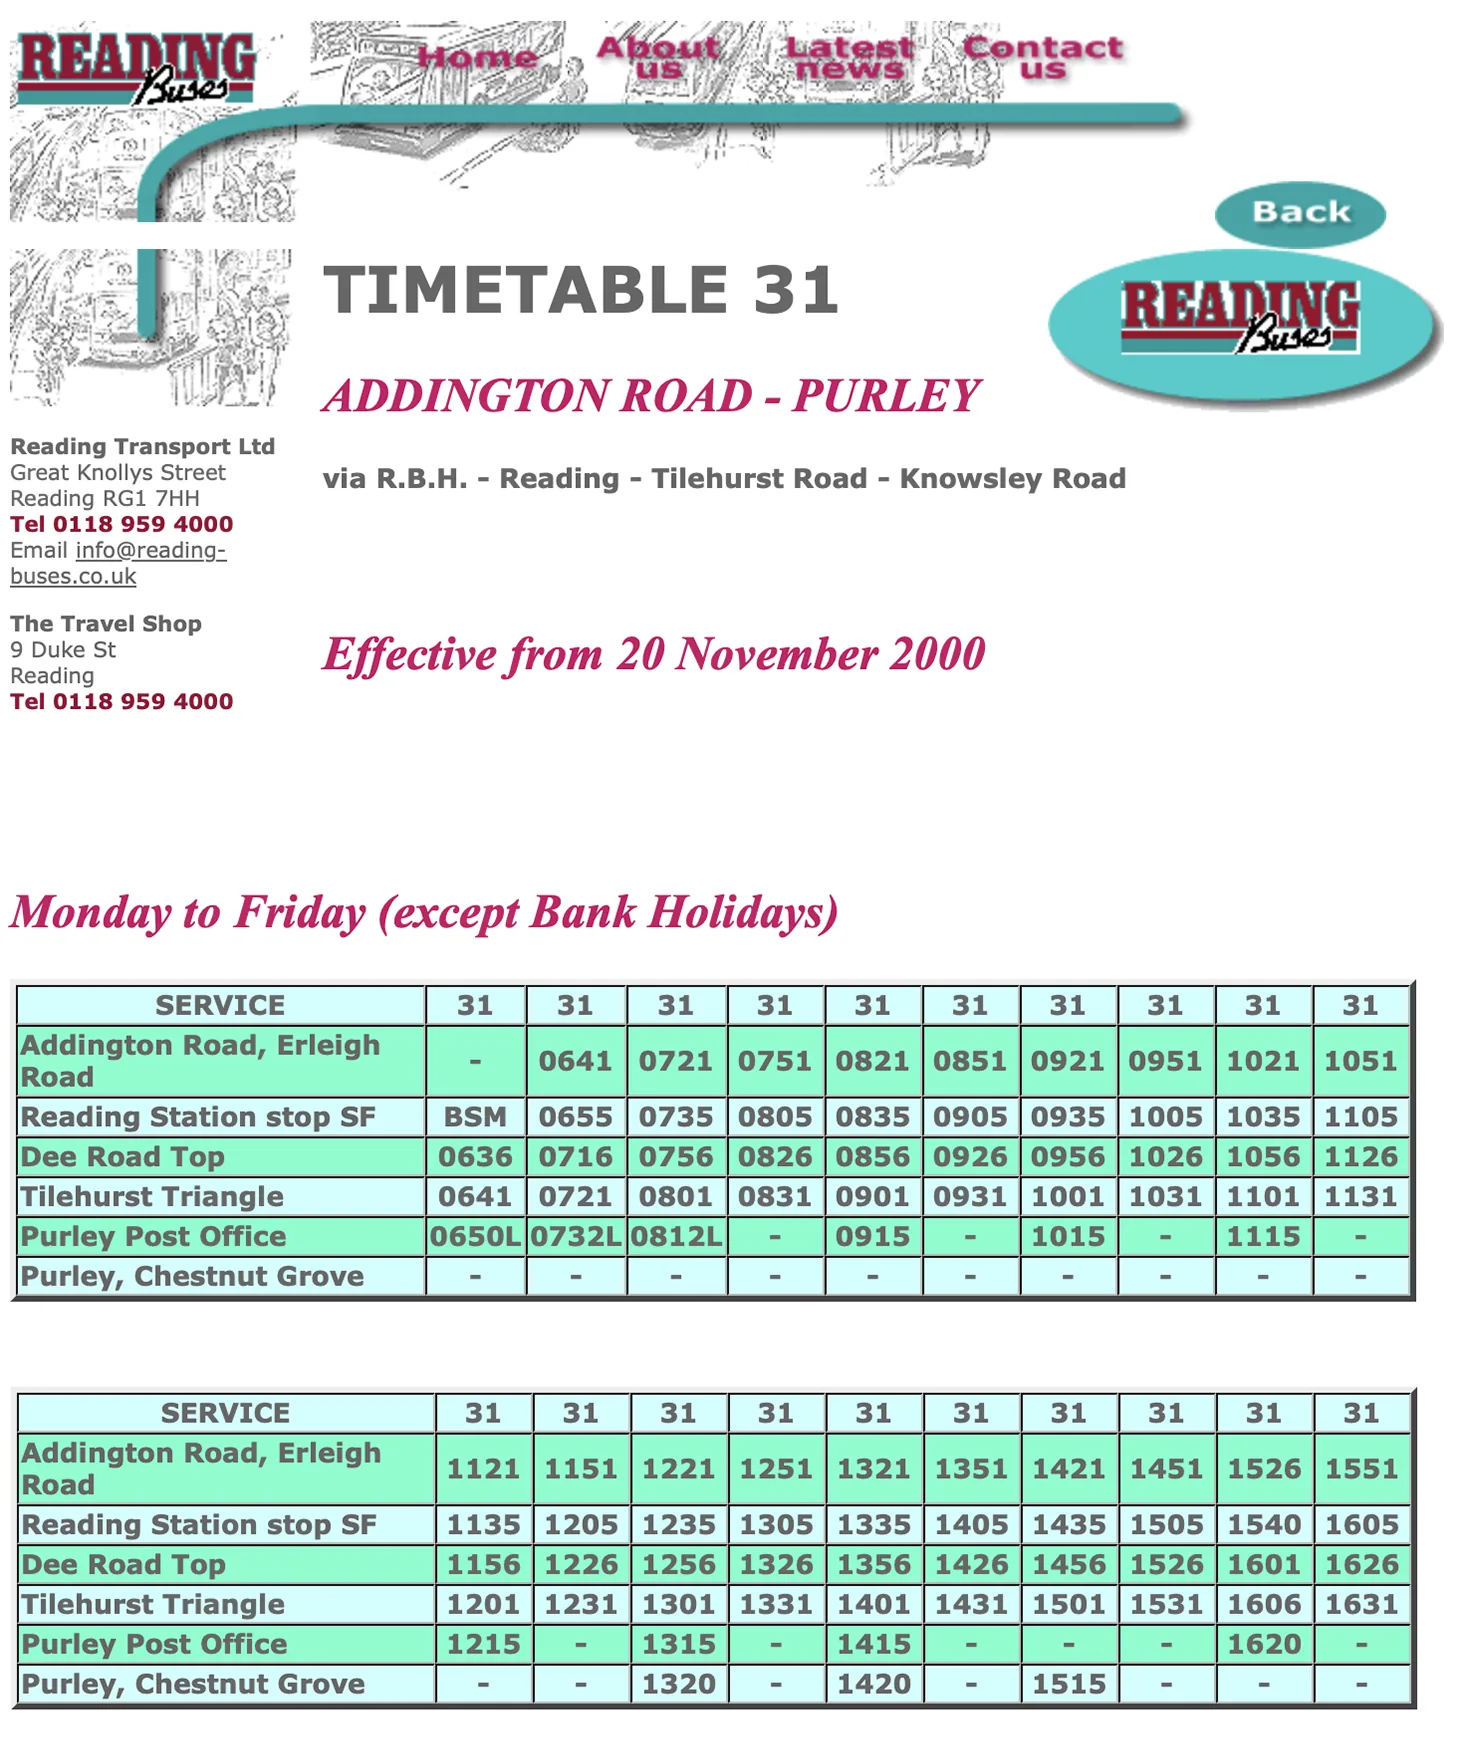
Route 31, November 2000. Even when it can be argued that the presentation on digital screens allowed for the dynamic display of routes, early digital timetables were very often nothing more than a digital edition of the printed schedule. Tap a number to read its note.
Print · 2000
Bold type, heading of each spread. The key route information is presented internally to the leaflet. Key route information is not available on the exterior of the leaflet.A straight line, ignoring geography, with all stops is provided with some highlighted. Neither interchanges nor nearby roads are provided in the network overview.A tenuous relationship can be seen. The stops indicated in the headings of the temporal tabular information are located on the map, but no typographic coding is provided to relate the two components in much detail.The route direction is implied only above the table using an explanatory phrase.Service availability is written in coloured blocks that act as headings to each column of the temporal tabular information.The temporal data is only available for the two terminus points. Numerals are tabular and align vertically, but times do not consistently have leading zeroes and so after 10:00 the times occupy more horizontal space.Deviations to service are detailed with a ‘note’ which uses letters to connect specific points in the tabular display to textual notes.
Route 31 in print: a map and both directions of travel on one spread.
West Reading and Tilehurst bus guidePublished by Reading Buses (July 2000)Spread 210 × 148 mmReading Central Library: Bus Ephemera box
1Route number. Bold type, heading of each spread. The key route information is presented internally to the leaflet. Key route information is not available on the exterior of the leaflet.
2Route map. A straight line, ignoring geography, with all stops is provided with some highlighted. Neither interchanges nor nearby roads are provided in the network overview.
3Map and table. A tenuous relationship can be seen. The stops indicated in the headings of the temporal tabular information are located on the map, but no typographic coding is provided to relate the two components in much detail.
4Direction of travel. The route direction is implied only above the table using an explanatory phrase.
5Days of operation. Service availability is written in coloured blocks that act as headings to each column of the temporal tabular information.
6Times. The temporal data is only available for the two terminus points. Numerals are tabular and align vertically, but times do not consistently have leading zeroes and so after 10:00 the times occupy more horizontal space.
7Notes and codes. Deviations to service are detailed with a ‘note’ which uses letters to connect specific points in the tabular display to textual notes.
Web · 2000
Bold type (all caps), heading of each page. The key route information is presented first with a list of services, arranged numerically, on the Route list page, and then on a page-by-page basis.Operator information displayed in a sidebar.The website does not feature an integrated map for the timetables, but there is some suggestion of route by means of text.Service availability is written in coloured italic type above individual examples of temporal tabular information.Presented as multiple tables stacked vertically, in 24-hour clock format. The times are not delineated. The temporal data is available for a range of stops across the route; each stop has listed (horizontally) all times that the bus stops there.Deviations to service are detailed with a ‘code’ which uses letters to connect specific points in the tabular display to textual notes.
Route 31 on the Reading Buses website in the same months.
Timetable 31: Addington Road – PurleyPublished by Reading Buses (effective from 20 November 2000)Designed for 720px screens; some elements repositioned to fix age-related CSS problemsInternet Archive, captured 12 April 2001
8Route number. Bold type (all caps), heading of each page. The key route information is presented first with a list of services, arranged numerically, on the Route list page, and then on a page-by-page basis.
9Operator details. Operator information displayed in a sidebar.
10Route in words. The website does not feature an integrated map for the timetables, but there is some suggestion of route by means of text.
11Days of operation. Service availability is written in coloured italic type above individual examples of temporal tabular information.
12Times. Presented as multiple tables stacked vertically, in 24-hour clock format. The times are not delineated. The temporal data is available for a range of stops across the route; each stop has listed (horizontally) all times that the bus stops there.
13Notes and codes. Deviations to service are detailed with a ‘code’ which uses letters to connect specific points in the tabular display to textual notes.
Findings
Key findings
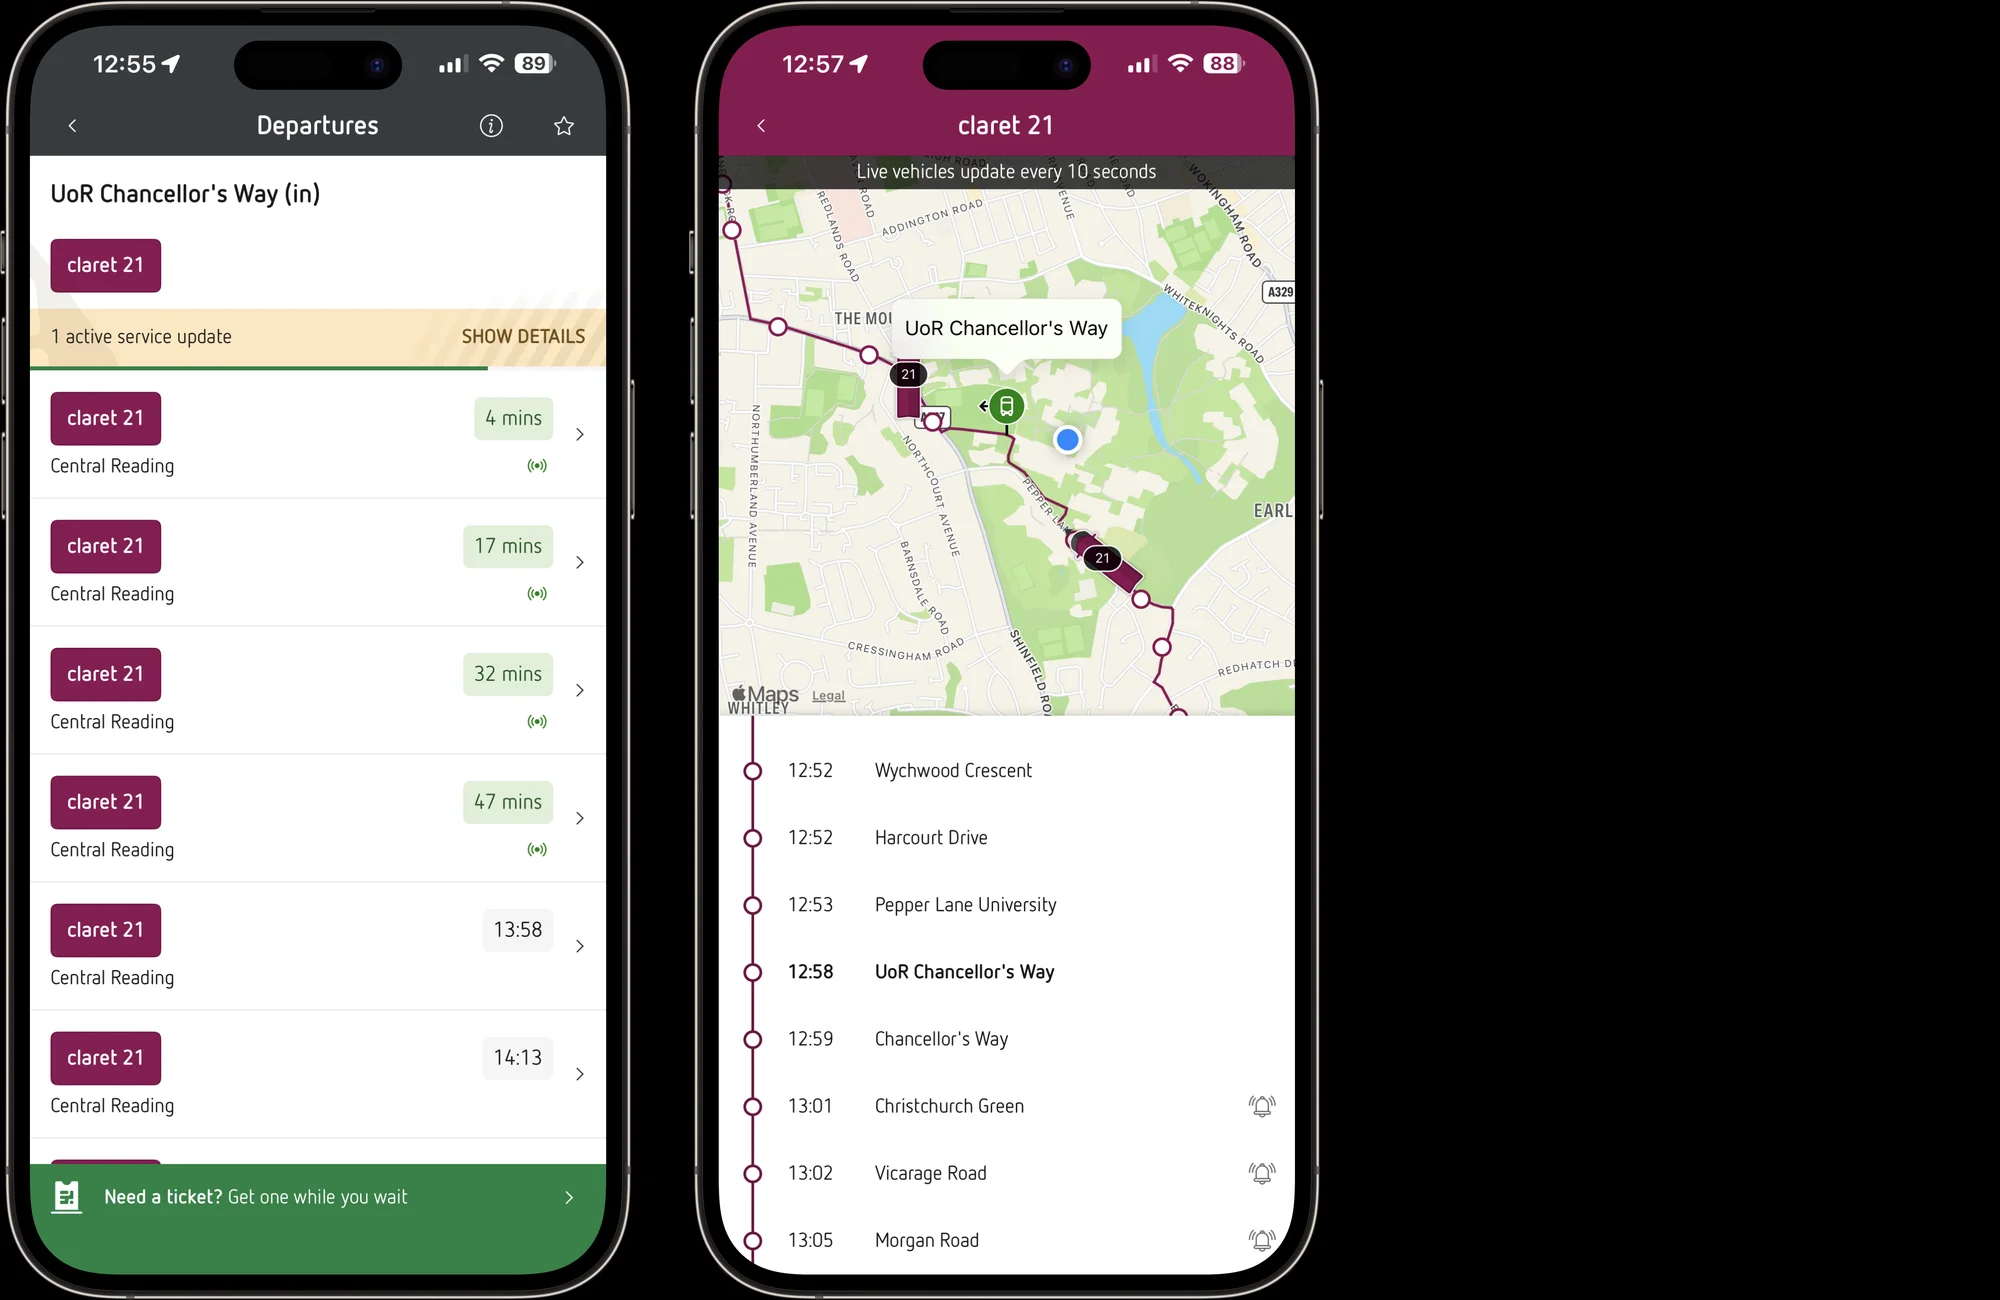
Live times are the biggest gain. Seeing how many minutes away the next bus is saves passengers working it out from a table.
‘The presentation of the real-time information generally enhances the user experience enormously. By virtue of the real-time information system, the cognitive load of the user is reduced as there is no need to compare the times manually.’
The printed map still explains the town better. The leaflet’s map shows the roads and places around the route, so passengers can tell where they are; the line drawn over a street map in the app does not.
‘The network overview of the printed timetable, taking on a hybrid role – between schematic map and street map – increases the ‘legibility’ of Reading as a town to a much greater extent than the purely geographical route maps available online and on the mobile apps.’
Changes of format have cost passengers before. Around 2000, the move to area booklets and the first website lost things that had worked, such as route numbers on the cover and a map beside the times.
‘The two main parts of the framework – the temporal tabular data and the network overview – repeatedly changed formats around the 2000s mark, resulting in a noticeable deterioration in the user experience.’
Apps don’t yet say what has changed. The app shows when a bus is coming, but not whether it is running late or taking a different route.
‘Delays are not indicated and manual comparison with the schedule is required; deviations to services are not explicitly mentioned and must be manually compared to ascertain deviation.’
Live times in the Reading Buses app: departures from UoR Chancellor’s Way, then claret 21 tracked along its route. Screenshots by the author, April 2026.
What this means in practice
For an operator today, the evidence suggests that the question is not whether to print or to go digital, but which qualities of each are worth keeping.
Keep the map that explains the place. The hybrid map of the printed leaflet – a simplified route that still shows nearby roads, places and interchanges – does more to orientate a passenger than a line drawn over a street map. It should be retained in print and, where possible, brought into the app and website in place of the purely geographical view.
Tie the times to the map. The leaflets that served passengers best used the same stops, names and typographic coding in the map and in the table. Digital timetables should do the same, so that a stop chosen on the map is the stop whose times are shown.
Show live times against the timetable. Real-time information is the clearest improvement of the period, but on its own it hides delay. Showing the scheduled time beside the expected time would let a passenger see at a glance whether their bus is running late.
Say when the service is different. Printed timetables have long used notes, letters and colour to flag journeys that start elsewhere or take another route. The same should be done digitally, beside the departures affected, rather than leaving passengers to work it out.
Check before changing format. Each move to a new medium has lost something that the previous one did well. Reviewing a new timetable against a simple checklist – route information, network overview, times, deviations – before launch would make sure that what worked is carried forward.
The hybrid map in the Yellow 26 timetable: a simplified route that keeps the roads and places around it. Published by Reading Buses (1 October 2014). Author’s collection.
The banner shows Time Tables for routes 137 and 138 (Reading Buses, January 1998); Service guide for services 22–54 (Reading Transport, September 1990); Service updates (Reading Buses, November 2000); Service guide for routes 61 and 62 (Reading Buses, October 1991); Royal Berkshire Hospital bus guide (Reading Buses, June 1998). All from the Bus Ephemera box, Reading Central Library, and shown at the same scale.
Pages 22–23 of the dissertation: the 1990s, ‘Working towards a visual identity?’ Ethan Nunn (April 2026), A4.
Work with me
Working on passenger information?
I design timetables, maps and wayfinding for people on the move. If you run buses, community transport or a heritage collection, I’d like to hear about what you’re working on.


 Bold type, heading of each spread. The key route information is presented internally to the leaflet. Key route information is not available on the exterior of the leaflet.A straight line, ignoring geography, with all stops is provided with some highlighted. Neither interchanges nor nearby roads are provided in the network overview.A tenuous relationship can be seen. The stops indicated in the headings of the temporal tabular information are located on the map, but no typographic coding is provided to relate the two components in much detail.The route direction is implied only above the table using an explanatory phrase.Service availability is written in coloured blocks that act as headings to each column of the temporal tabular information.The temporal data is only available for the two terminus points. Numerals are tabular and align vertically, but times do not consistently have leading zeroes and so after 10:00 the times occupy more horizontal space.Deviations to service are detailed with a ‘note’ which uses letters to connect specific points in the tabular display to textual notes.
 Bold type (all caps), heading of each page. The key route information is presented first with a list of services, arranged numerically, on the Route list page, and then on a page-by-page basis.Operator information displayed in a sidebar.The website does not feature an integrated map for the timetables, but there is some suggestion of route by means of text.Service availability is written in coloured italic type above individual examples of temporal tabular information.Presented as multiple tables stacked vertically, in 24-hour clock format. The times are not delineated. The temporal data is available for a range of stops across the route; each stop has listed (horizontally) all times that the bus stops there.Deviations to service are detailed with a ‘code’ which uses letters to connect specific points in the tabular display to textual notes.